


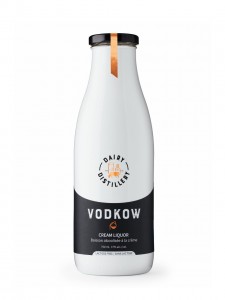

Whiskey is a distilled alcoholic beverage named from the Gaelic ‘uisge beatha’ meaning ‘water of life’. The drink is made from fermented grain mash, with different grains used to provide the wide variety of whiskey available. When bottles of whiskey are sold, they will contain a % abv, this relates to how much ethanol is present in the bottle. Commonly, whiskey is 40% abv, thus 40% of the bottle should be ethanol. Whiskey is an increasingly popular drink, with the Scotch Whiskey Association stating 44 bottles of Scotch Whiskey are exported every second, with exports worth £4.5bn in 2021.
Fraudulent sales of drinking alcohol, especially spirits, is a concerning and potentially dangerous way in which vendors try to increase their profits. There are two common ways in which alcohol is sold illegally, firstly is the sale of watered down alcohol. This is either done in bulk, where bottles are sold with fraudulent % abv’s printed on them, or in bars where spirits are diluted after wholesale purchase. The second issue seen in alcohol fraud is more sinister where methanol is used in spirits, instead of ethanol.
Ethanol metabolizes in the liver by a process called alcohol dehydrogenase eventually being broken down to harmless carbon dioxide and water. Methanol meanwhile is toxic to humans; it’s commonly found in antifreeze. The two molecules only differ by one carbon and two hydrogen atoms, but after consuming methanol, the alcohol dehydrogenase enzyme converts the methanol into formaldehyde, which is then rapidly metabolized into formic acid. According to the toxicological overview from Public Health England, methanol is toxic following ingestion, inhalation, and via dermal exposure. The potential effects from methanol poisoning range from, but are not limited to, central nervous system depression, nausea, blindness, coma, and death.
Determining the percentage of ethanol in bottles of whiskey is required to ensure products are being sold authentically and checking there is no methanol present in bottles is critical for keeping products safe for consumption. This article details how Raman spectroscopy can offer quantitative and qualitative analysis of whiskey samples.
Materials and methods
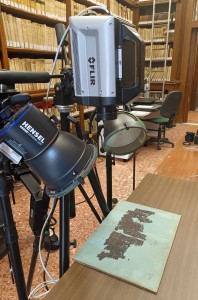
An RM5 Raman Microscope equipped with a 785 nm excitation laser and a cuvette holder was used for the analysis. Pure ethanol and methanol were purchased from Merck for the standard solutions, whiskey samples were sourced locally. To create the calibration curve aqueous solutions of 20%, 40%, 60%, 80%, and 100% of ethanol were made. Raman spectra were taken for each solution and sample using the same measurement conditions: 100% laser power, 0.5 second exposure time, 300 gr/mm grating, 100 µm slit, 2 mm pinhole.
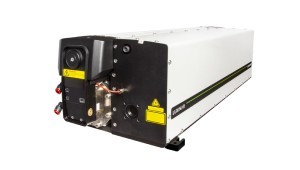
, RM5 Raman Microscope (right)")
Figure 2: : Cuvette holder (left), RM5 Raman Microscope (right)
A whiskey sample was spiked to create a whiskey solution with 10% methanol concentration. A comparison between unspiked whiskey, spiked whiskey, and methanol was carried out using a 300 gr/mm grating to observe the full spectral range in a single snapshot, and with a 1200 gr/mm grating to see higher spectral definition in the fingerprint region of the spectrum (300 cm-1 to 1800 cm-1).
Verifying ethanol content
In analytical chemistry a calibration (or standard) curve is a method for determining the concentration of unknown samples by comparing the unknown to a series of samples of known concentrations. In the case of ethanol, a known peak is selected at approx. 880 cm-1 attributed to the C-C-O symmetric stretching vibration. The peak area will increase linearly with increasing ethanol concentration and using these data points a calibration curve can be created, Figure 3.
 and whisky samples (green)")
Figure 3: Ethanol calibration curve (burgundy) and whiskey samples (green)
After obtaining the calibration curve, using the equation of the line the ethanol content of the whiskey samples can be determined and plotted on the calibration curve, Figure 3. The two whiskey samples both had the ethanol % stated on their bottles, Table 1. To further show how Raman spectroscopy can be used quantitatively for ethanol content determination a sample was diluted with water and its Raman spectrum acquired again. As expected, the area of the ethanol band decreases, and the calibration curve allows the ethanol % to be calculated at 32.6%.
Identifying methanol in whiskey
Despite being so close chemically, methanol and ethanol have different Raman spectra, Figure 4. When using Raman spectroscopy to check for the presence of methanol two bands are generally used, at approx. 1035 cm-1 and approx. 2845 cm-1.
.")
Figure 4: Raman spectrum of ethanol and methanol (insert is expanded high wave number region).
Knowing the bands of interest, spectra of whiskey and a whiskey sample spiked to contain 10% methanol were acquired, Figure 5. Between the two samples there are clearly spectral differences, which can be attributed to the addition of methanol.

Figure 5: Normalised Raman spectra of an unspiked and spiked sample of whisky focussed on the two spectral regions of interest.
The spectra in Figure 5 were acquired with a 300 gr/mm grating resulting in the peaks between 1000 cm-1 and 1200 cm-1 merging into one peak with two shoulders. When the whisky sample was spiked with methanol the peak at approx. 1050 cm-1 was shifted to 1042 cm-1 due to the influence of the methanol peak at 1035 cm-1. While this allows the conclusion the sample contains methanol the three expected peaks cannot be resolved; this is due to the level of spectral resolution achievable with a 300 gr/mm grating. The spectral resolution can be increased by using a grating with more grooves per millimetre, in this case a 1200 gr/mm. Figure 6 shows as the grooves are increased the spectral resolution increases to allow the observation of all 3 peaks, providing certain evidence of the presence of methanol.
Figure 6: Offset normalized Raman spectra of ethanol (burgundy), methanol (green), whiskey (orange), spiked whiskey (purple) using a 1200 gr/mm grating.
We have demonstrated both the qualitative and quantitative use of Raman spectroscopy. Calibration curves can easily be created using band information from Raman spectra allowing the quantitative evaluation of ethanol % for whiskey authenticity testing. Qualitatively, the excellent chemical discrimination of Raman was used to identify the illicit presence of methanol in a whiskey sample. All samples can be analyzed rapidly making Raman spectroscopy an ideal technique for ensuring whiskey is being sold safely and legitimately.
Written by Angela Flack, Application Specialist, Edinburgh Instruments